
Business Challenge
Sales, inventory and customer data live in separate files and systems. Managers spend time reconciling reports instead of acting on them.
Data Structure
A star-schema model: a sales fact table linked to product, branch, customer and date dimensions, so every measure can be filtered consistently.
Dashboard Design
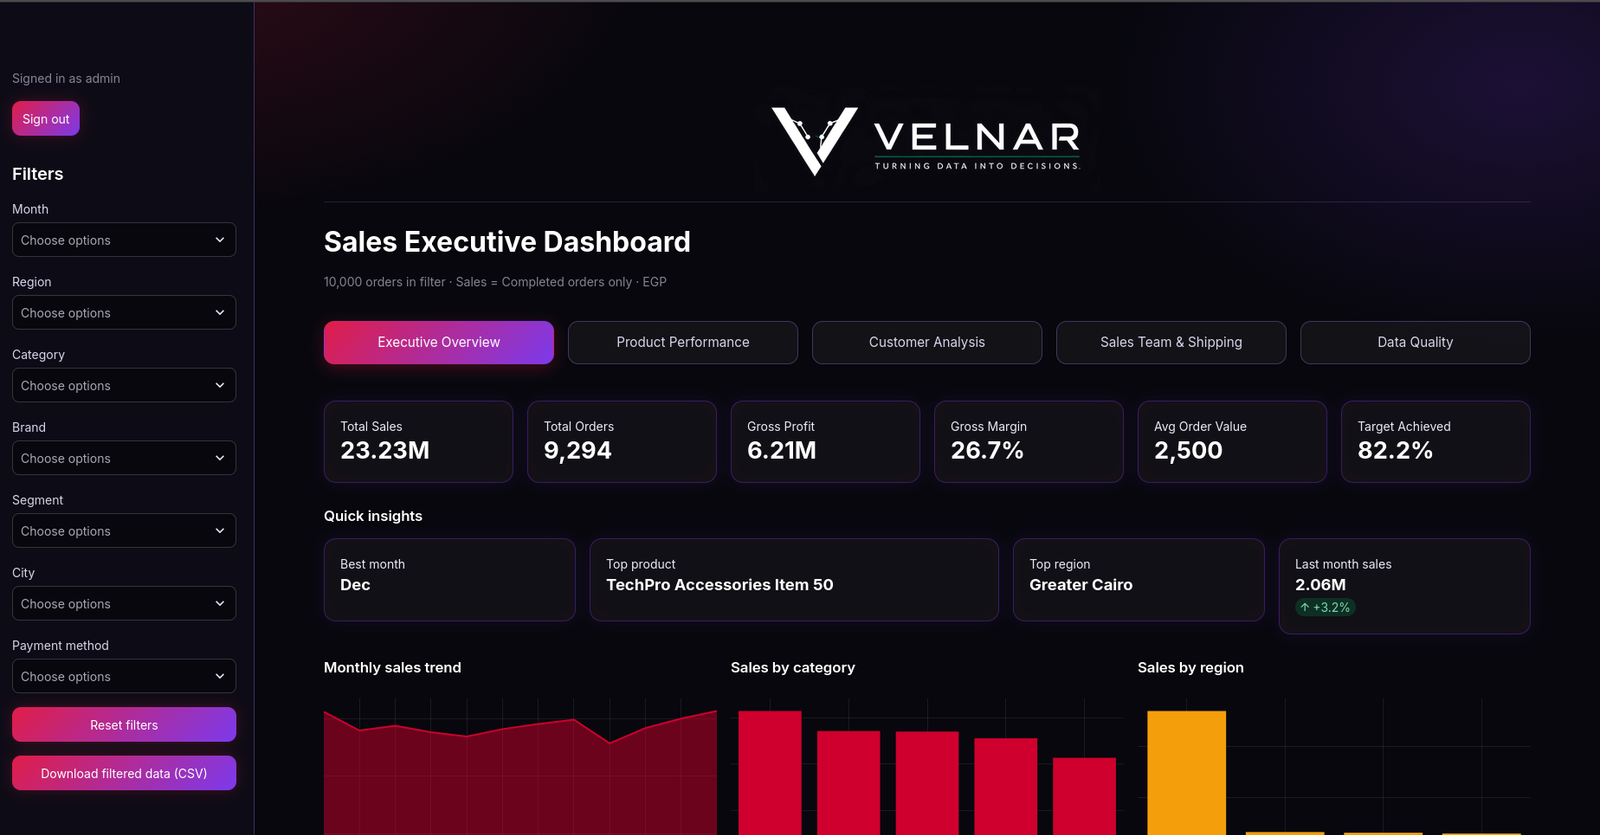
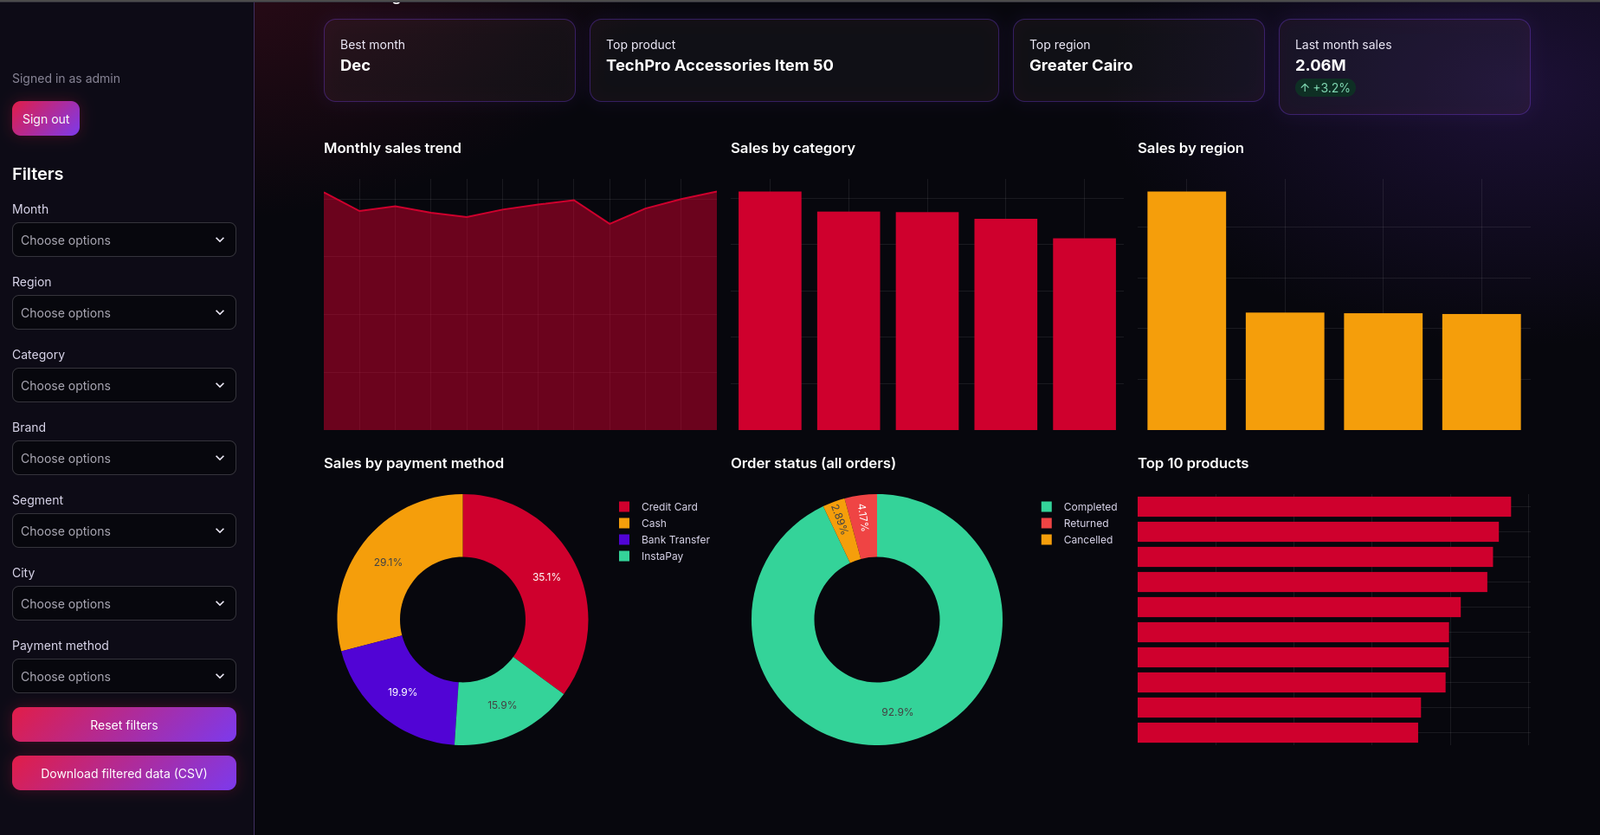
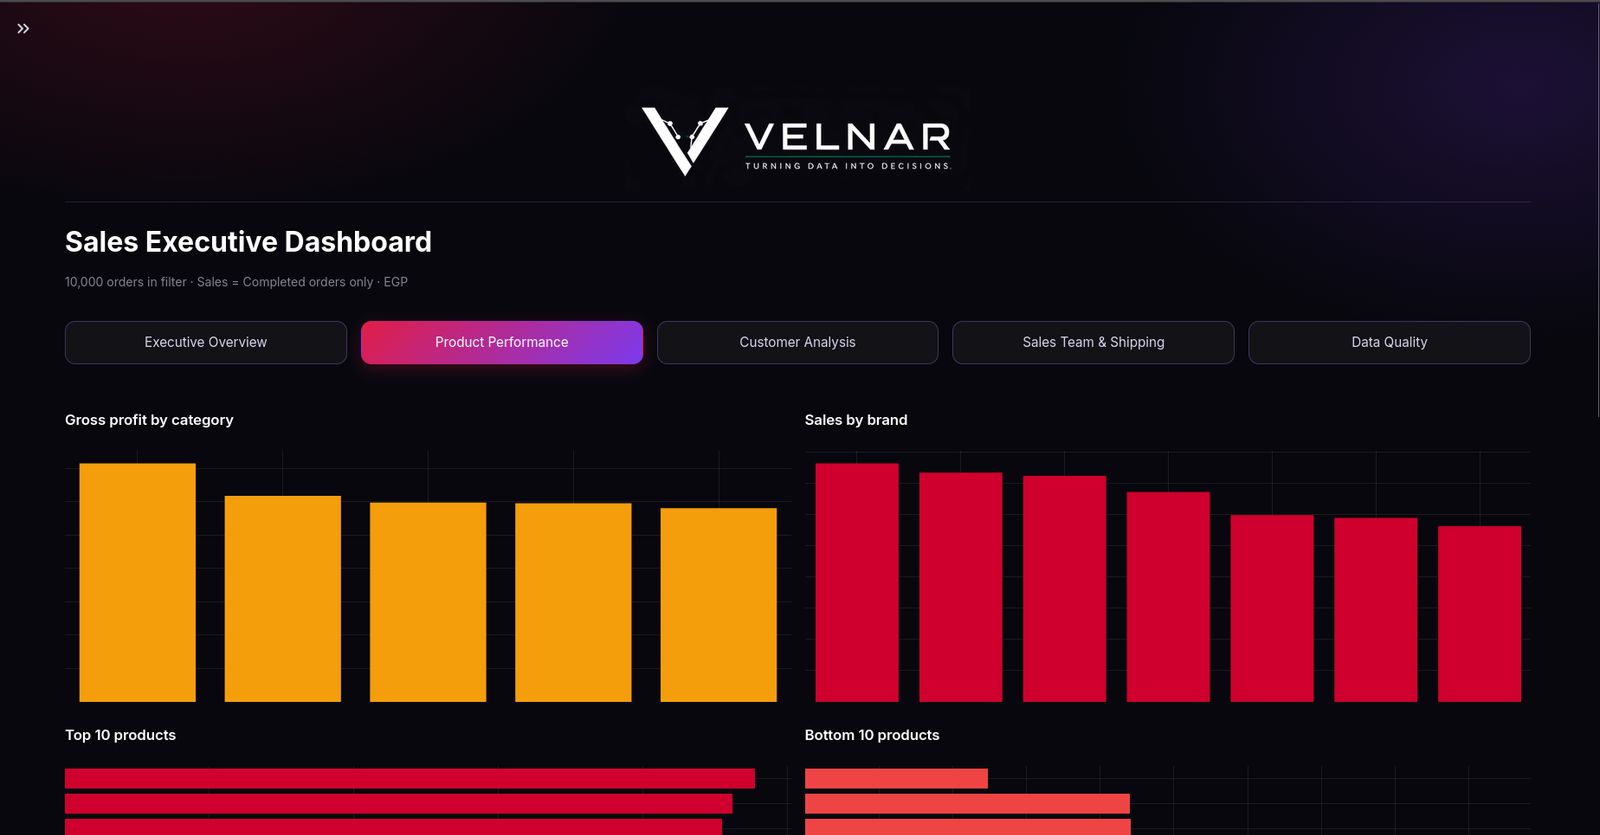
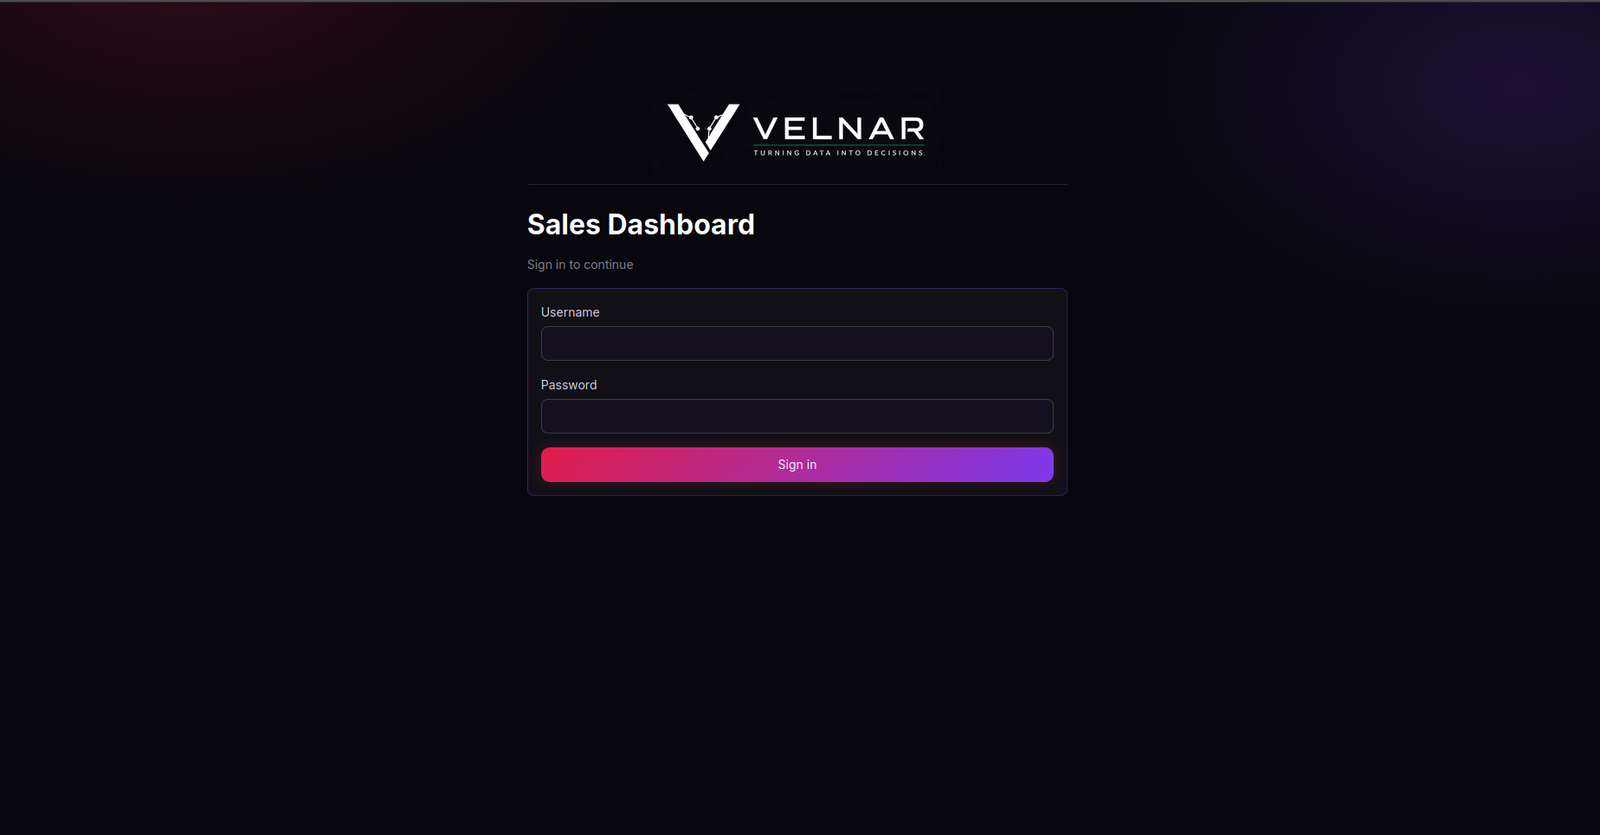
An overview page with KPI cards for Total Revenue, Total Orders and Average Order Value, followed by sales trend, product and branch views, with slicers for date, branch and category. The dashboard is organised into five views (Executive Overview, Product Performance, Customer Analysis, Sales Team & Shipping and Data Quality), with a secure sign-in, filters for month, region, category, brand, segment, city and payment method, and one-click CSV export.
Key Insights
Synthetic data only. The design shows how a single view can reveal which branches and products drive revenue and how sales move over time.
Business Recommendations
Standardise KPI definitions across branches, review weak-performing products against stock levels, and schedule data refreshes so reports stay current.