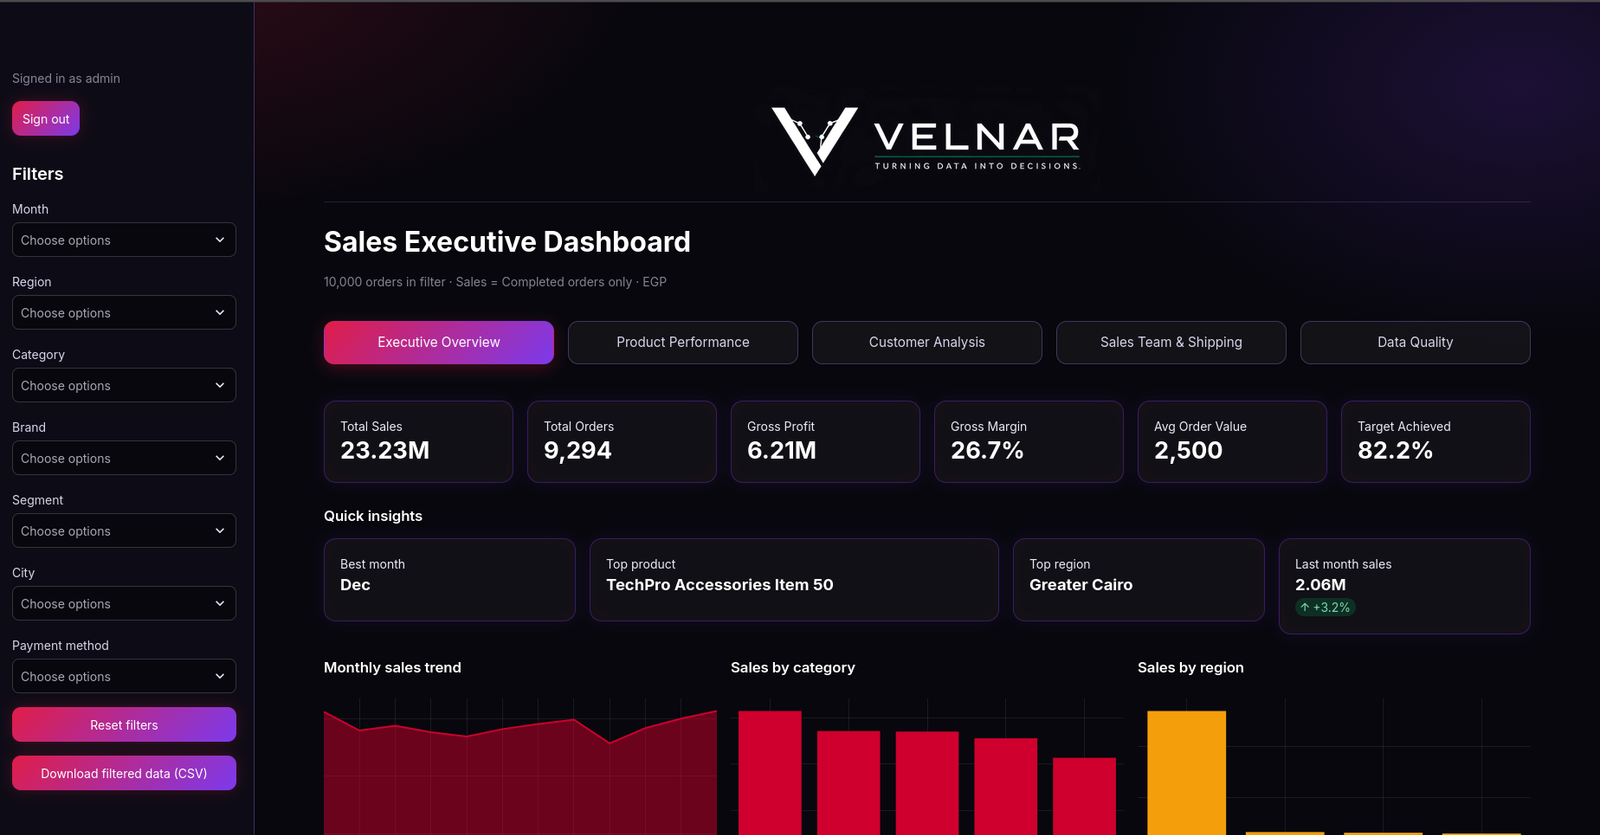
Retail Business Intelligence Dashboard
A secure, interactive executive dashboard that turns 10,000 retail orders into clear answers on sales, profit, products, customers and data quality, with smart filters and one-click export.
Explore Case Study
TURNING DATA INTO DECISIONS
We help businesses unlock the full value of their data through customer analytics, interactive Power BI dashboards and forecasting.
Businesses generate enormous amounts of data every day. Yet without the right analytical approach, valuable information remains hidden across disconnected systems and reports.
At VELNAR, we transform business data into structured insights that help organizations understand performance, identify opportunities, anticipate demand, and make informed decisions.
Practical analytical solutions designed to solve real business challenges.
Gain a deeper understanding of customer behavior, purchasing patterns, retention, and long-term value.
Transform business data into interactive Power BI dashboards that provide clear visibility into business performance. Microsoft Power BI is our primary reporting and visualization platform.
Illustrative mockup, not a Microsoft screenshot.
Use historical business data and statistical forecasting techniques to estimate future trends and support better planning.
Illustrative. Solid = actual, dashed = forecast, shaded = interval.
Different industries generate different data challenges. VELNAR focuses on understanding business operations and developing analytical solutions aligned with each organization's needs.
A secure, interactive executive dashboard that turns 10,000 retail orders into clear answers on sales, profit, products, customers and data quality, with smart filters and one-click export.
Explore Case StudyAn analytical demonstration exploring customer purchasing behavior, segmentation, retention patterns, and customer lifetime value.
Explore Case StudyA demonstration of how historical retail data can be used to estimate future sales and demand patterns.
Explore Case StudyUnderstand the organization's business model, objectives, challenges, and decision-making requirements.
Evaluate available data sources, data structure, completeness, consistency, and analytical suitability.
Prepare and structure data for reliable analysis and reporting.
Apply appropriate analytical and statistical methods based on the business problem.
Transform analytical outputs into clear reports, dashboards, and visual insights.
Translate findings into practical recommendations that support informed business decisions.
VELNAR is a data analytics and business intelligence company focused on helping organizations better understand their customers, monitor business performance, and anticipate future trends.
We combine analytical thinking, statistical methods, and modern visualization tools to transform complex business data into clear and actionable insights.
Our philosophy is simple: analytics should not stop at presenting numbers. It should help businesses understand what is happening, why it is happening, and what decisions they can make next.
Whether you're looking to understand your customers, improve business visibility, or forecast future demand, VELNAR is ready to explore how analytics can support your business.
Business email: [placeholder]
Phone: [placeholder]
LinkedIn: [placeholder]
Location: [placeholder]